Interactive Knowledge Graph: Network Visualization for AI Industry Intelligence
Scroll to explore
Interactive Knowledge Graph: Network Visualization for AI Industry Intelligence
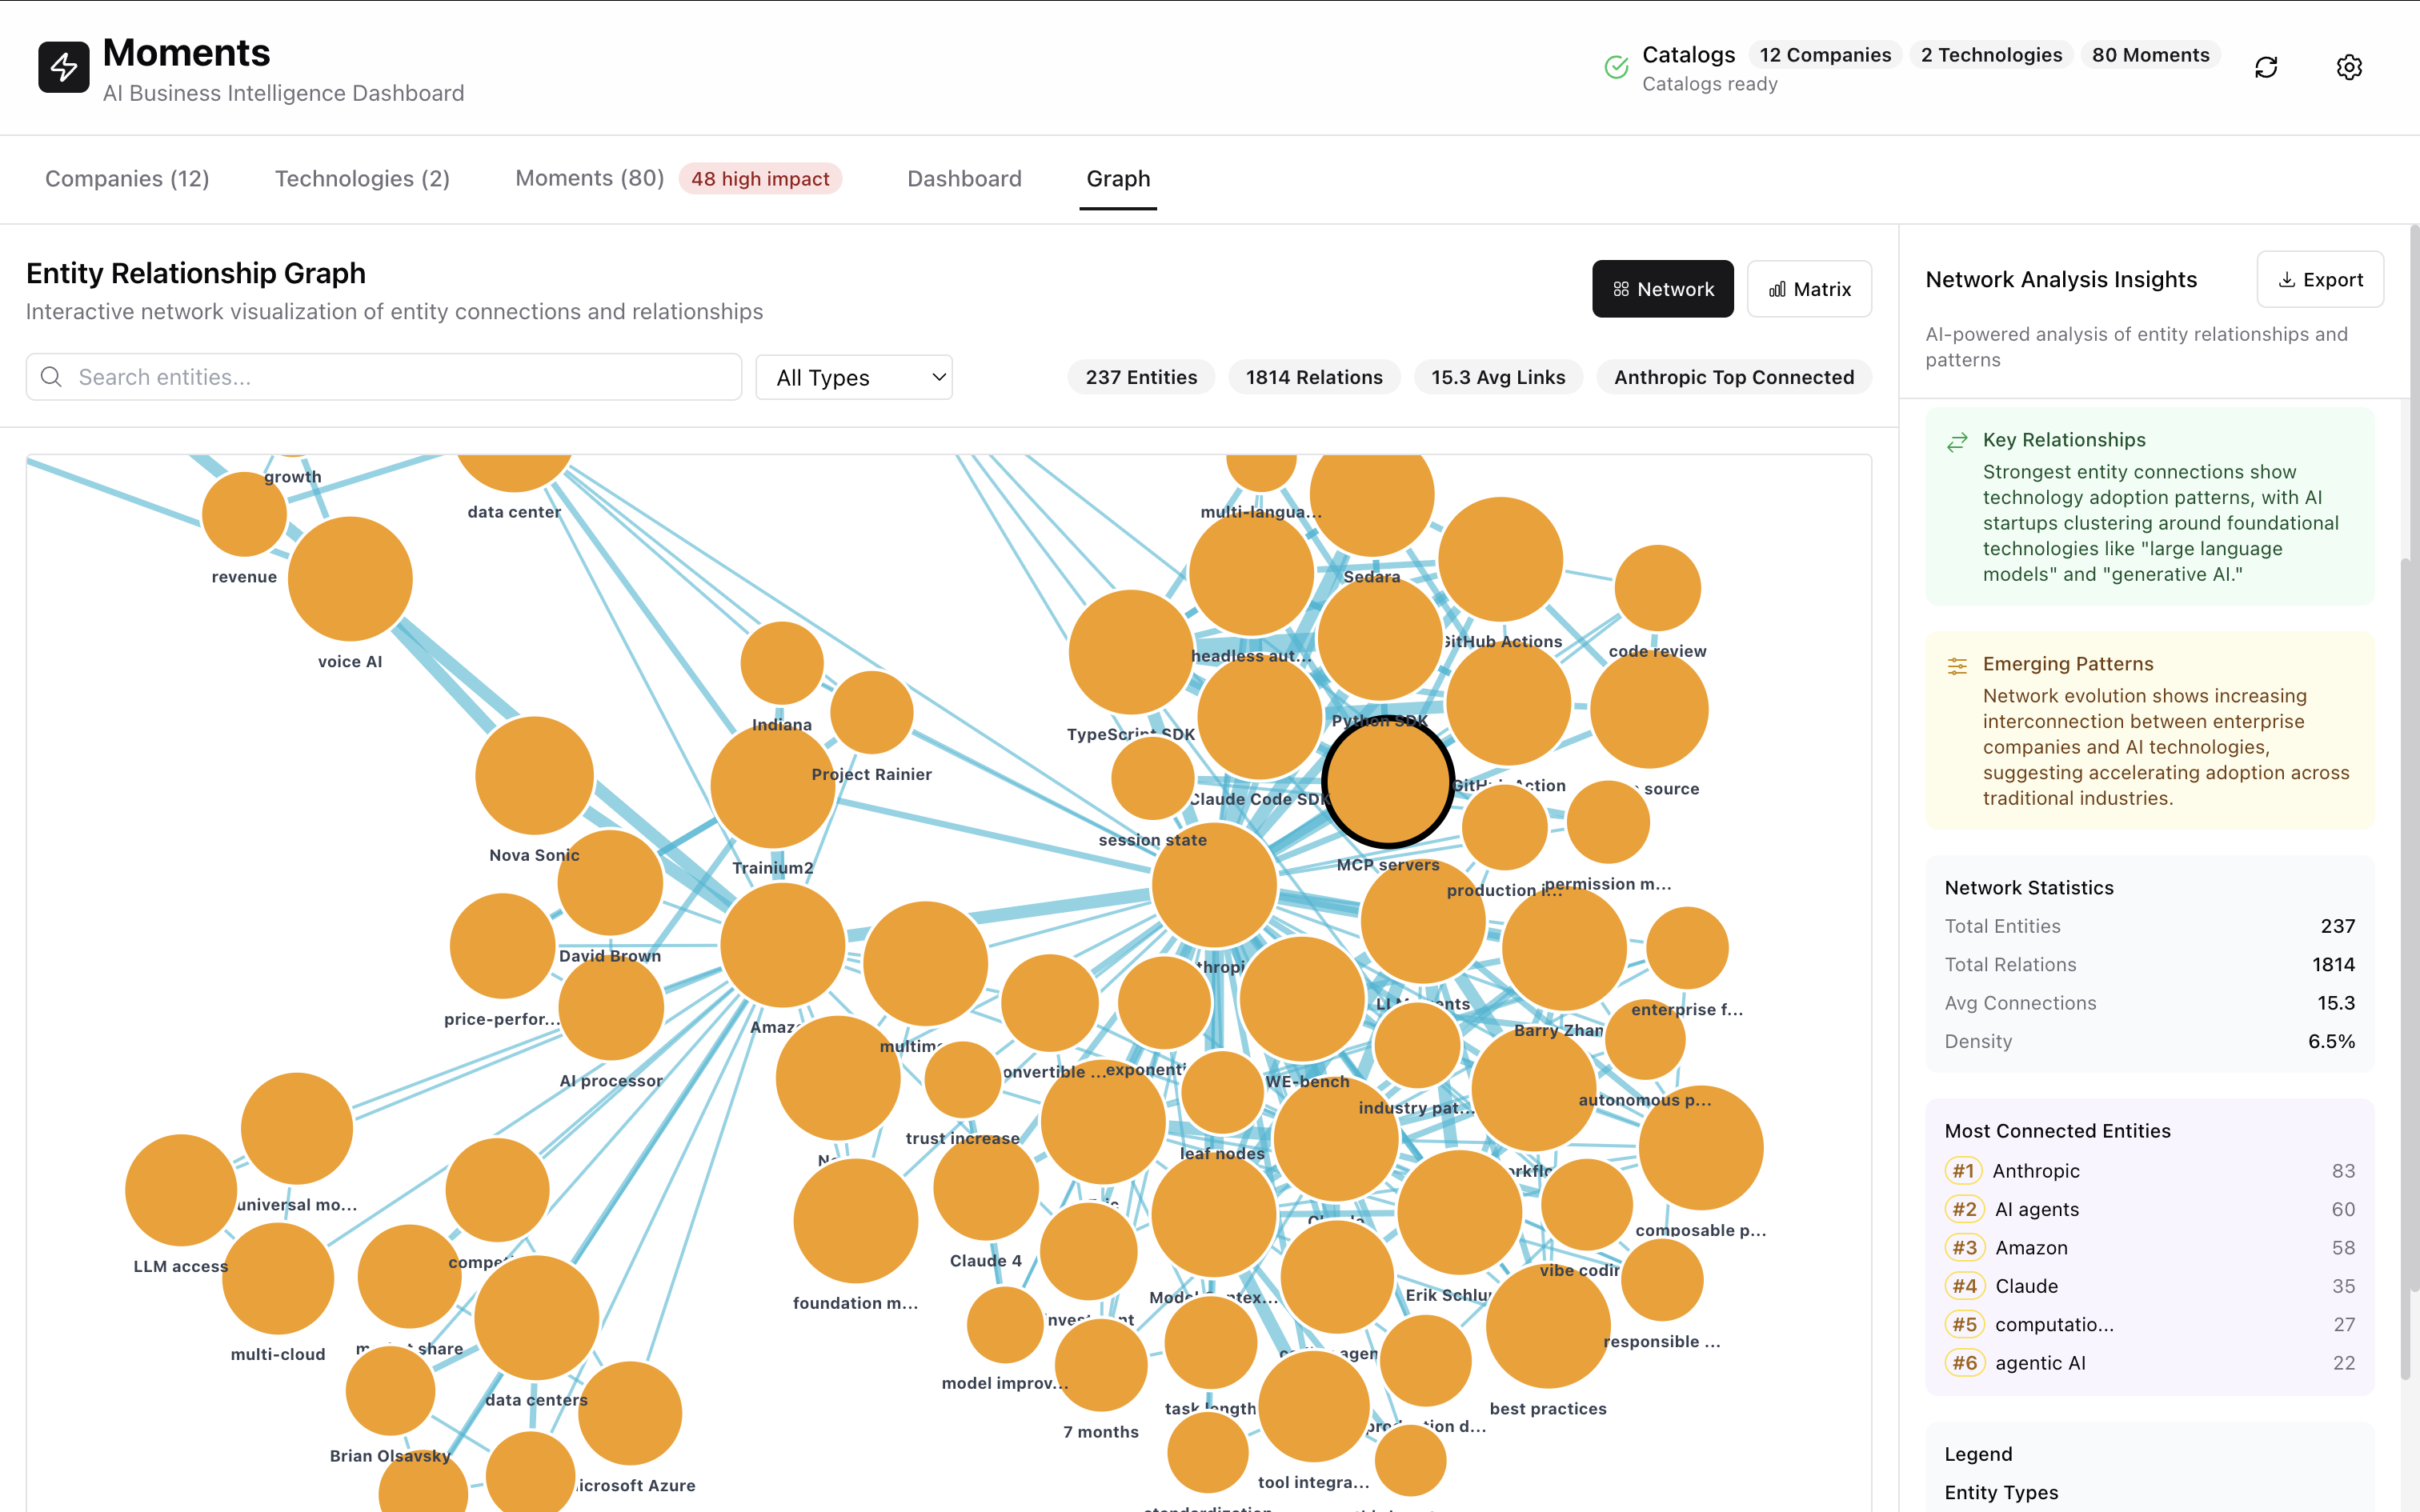
The complexity of the modern AI ecosystem demands sophisticated visualization tools that can reveal hidden patterns and strategic relationships. The Moments Entity Relationship Network Graph transforms this complexity into actionable intelligence through interactive force-directed visualization, mapping 237 entities connected through 1,814 relationships with an average of 15.3 links per entity.
The Power of Network Intelligence
According to Gartner’s latest research on graph analytics, organizations using graph-based intelligence are 2.5x more likely to identify market opportunities before competitors. The Moments knowledge graph leverages this advantage through multi-dimensional relationship mapping.
Multi-Entity Network Architecture
The visualization employs a sophisticated node-based system representing three critical entity types:
Companies (Orange Nodes)
- AI startups positioned by market influence
- Established enterprises sized by connection density
- Technology providers weighted by ecosystem impact
Technologies (Blue/Green Nodes)
- AI frameworks and tools mapped by adoption patterns
- Innovation velocity indicated through node prominence
- Integration dependencies revealed through edge connections
Concepts (Yellow Nodes)
- AI methodologies and business applications
- Strategic positioning through semantic relationships
- Market applications validated through real-world connections
Advanced Relationship Intelligence
The knowledge graph’s edge rendering system provides unprecedented insight into relationship dynamics, aligning with the enhanced data visualization trends for 2025:
Relationship Strength Visualization
Edge Width Proportionality
- Thick edges indicate strong partnerships or major technical dependencies
- Medium edges represent moderate business relationships or technology adoption
- Thin edges highlight emerging connections or potential opportunities
Color-Coded Relationship Types
- Green: Collaborative partnerships driving innovation
- Red: Competitive dynamics shaping market boundaries
- Purple: Technology adoption and implementation patterns
- Cyan: Conceptual and methodological connections
- Orange: Strategic market positioning
Network Analysis and Strategic Insights
Cluster Detection: Ecosystem Mapping
The graph’s clustering algorithm has identified 48 distinct entity clusters, revealing how companies naturally organize around foundational technologies. This pattern recognition capability supports augmented analytics, where AI automates the discovery of strategic groupings.
Key findings from cluster analysis:
- Technology hubs forming around large language models
- Enterprise coalitions emerging in specific verticals
- Innovation clusters at the intersection of research and commercialization
Influence Mapping and Centrality
Network centrality analysis reveals the most influential entities:
- Anthropic: 83 connections - Central AI research hub
- AI agents: 60 connections - Foundational methodology
- Amazon: 58 connections - Enterprise platform leader
- Claude: 35 connections - Growing LLM ecosystem
- Competitions: 32 connections - Market dynamics driver
These metrics provide critical intelligence for:
- Partnership strategy development
- Investment target identification
- Competitive positioning assessment
Interactive Exploration Capabilities
The knowledge graph implements self-service analytics principles, enabling users to explore relationships independently:
Dynamic Navigation Features
- Real-time search across all 237 entities
- Type-based filtering for focused analysis
- Connection highlighting revealing relationship chains
- Smooth zoom and pan for detailed exploration
Advanced Analysis Tools
- Path analysis between specific entities
- Centrality metrics calculating influence scores
- Cluster exploration for strategic group identification
- Export capabilities for external analysis
Business Applications and Use Cases
Competitive Intelligence
Organizations leverage the knowledge graph for strategic advantage:
- Market Positioning: Understanding competitive relationships and alliance structures
- Partnership Discovery: Identifying collaboration opportunities through network gaps
- Influence Analysis: Tracking entities driving industry-wide changes
- Trend Prediction: Anticipating market shifts through relationship evolution
Investment Strategy
The graph supports data-driven investment decisions aligned with AI market projections of $1.8 trillion by 2030:
- Ecosystem Assessment: Evaluating companies within network context
- Technology Tracking: Monitoring innovation diffusion patterns
- Risk Analysis: Understanding dependency chains and vulnerabilities
- Portfolio Optimization: Balancing investments across network clusters
Innovation Planning
R&D teams utilize network insights for strategic development:
- Technology Mapping: Identifying integration opportunities
- Collaboration Networks: Finding strategic research partners
- Market Evolution: Tracking relationship changes over time
- White Space Analysis: Discovering underserved network areas
Technical Implementation Excellence
The knowledge graph leverages cutting-edge visualization technology:
Performance Optimization
- WebGL rendering for smooth interaction with 1,800+ edges
- Force-directed algorithms creating intuitive layouts
- Progressive loading for responsive user experience
- GPU acceleration enabling real-time updates
Integration Capabilities
Following embedded analytics trends:
- RESTful API for programmatic access
- WebSocket support for real-time updates
- Export formats including JSON, GraphML, and CSV
- Embedding options for dashboard integration
Security and Data Governance
Implementing enterprise-grade security standards:
- Encrypted data transmission
- Role-based access control
- Audit logging for compliance
- Data residency options
Implementation Strategy
For organizations adopting the Moments knowledge graph, we recommend:
- Discovery Workshop: Map key entities and relationships
- Pilot Deployment: Test with specific use cases
- Training Program: Build internal graph literacy
- Integration Phase: Connect with existing BI systems
- Expansion Strategy: Scale across departments
Future Enhancements
The knowledge graph roadmap includes:
- Temporal Analysis: Time-based relationship evolution
- Predictive Modeling: AI-powered relationship forecasting
- 3D Visualization: Immersive network exploration
- Natural Language Interface: Conversational graph queries
ROI and Business Impact
Organizations report significant returns from knowledge graph implementation:
- 45% reduction in market research time
- 3x increase in partnership opportunity identification
- 60% improvement in competitive intelligence accuracy
- Real-time alerts on critical relationship changes
Conclusion
The Moments Interactive Knowledge Graph transforms the overwhelming complexity of AI industry relationships into clear, actionable intelligence. By visualizing 237 entities and 1,814 relationships through sophisticated force-directed algorithms, organizations gain unprecedented insight into market dynamics, competitive positioning, and strategic opportunities.
As the AI industry continues its exponential growth, the ability to understand and navigate complex relationship networks becomes a critical competitive advantage. The Moments knowledge graph provides not just visualization, but a comprehensive intelligence platform for strategic decision-making in the AI ecosystem.
For enterprises seeking to understand their position in the AI landscape, identify strategic opportunities, and navigate competitive dynamics, the Moments knowledge graph offers an essential tool for transforming network complexity into strategic clarity.